Performance Testing for Dummies
- Home
- Blog
Performance testing for dummies
The iterative style of development in the Agile has changed the way we build and test the software. During the waterfall days, the performance test was primarily executed in the last phase of the product. However, an agile approach requires you to test your product before every release. The shift towards continuous integration and development has changed how we plan overall performance tests and how often we test however there has not been any change in the way we strategize the performance testing.
Though we no longer are required to build elaborate test plans that we used to write when the waterfall model was prevalent, we still should invest a great deal of time and effort in strategizing the performance testing project.
The first step of which is building the workload model.
- What is the workload model? The workload model is the primary artefact in the performance testing process based on which performance testing approach is decided. The principal objective behind the workload model is to identify the list of critical business transactions and the load distribution for running various performance tests such as load, volume, spike, stress and scalability.
-
Following are the primary phases in the performance testing life
cycle planning.
1. Defining non-functional requirements & service level agreements.
2. Workload Modelling.
3. Scripting of (for automation) critical business processes using your preferred tool.
4. Building pipelines to run your tests.
5. Running baseline performance tests and performance benchmarking.
6. Performance monitoring.
7. Reporting.
Let us assume that your business owner has expectations that under standard peak load, 90 percent of the critical transactions should be completed within 3 seconds and remaining 10 percent within the SLA of 10 seconds
-
In this blog, we shall discuss the workload modelling
Performance tests are executed to full-proof your application from probable failures that may occur due to sudden (Spike testing) or gradual increase in the load or volume (scalability testing), from infrastructure failures, from untuned code or a performance bottleneck due to incorrectly configured components in the system.
The objective of performance testing is to simulate a load onto a production-like environment and identify gaps in your application and environment before they become a real business problem. This can only be achieved by first building an appropriate simulation model that correctly captures your critical business processes, list of critical APIs or database queries. The workload model is the document that will capture these details and also provide the calculations that will guide a performance tester with required details to carry out performance testing such as an expected number transactions per seconds (TPS), pacing and thinking time calculations for every in-scope business-critical process.
-
There are four different sources of truths that a performance
engineer should utilize to build his workload model.
Source Type Tools/Sources Actuals/Production logs Web server logs, Database queries, or Data mining tools such as Splunk or Logstash Kibana. Testimony (from Business) A businessperson who has an understanding of the expected growth of the software product you are testing. Comparison Your competitor’s product in the market or their published sales numbers. Inference Result of the process of reasoning in which the tester knows some unperceived character of a software product through the testing or domain experience.
-
Parrot Principle or 80/20 rule
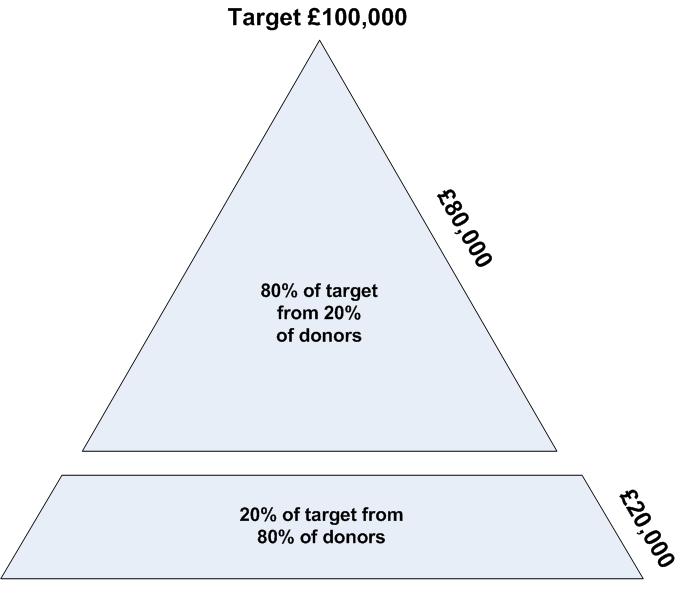
The widely accepted approach in the performance testing space is that 80% business volume is contributed by 20% business transactions. The workload model for performance testing is often designed with the same assumptions that are based on the Pareto principle.
The Pareto principle (also known as the 80/20 rule, the law of the vital few, or the principle of factor sparsity) states that, for many events, roughly 80% of the effects come from 20% of the causes.
Following is the pictorial illustration of the Pareto principle applied to community fundraising

Let us say after applying the above principle you have recognised the list of the critical business transactions. And based on the data obtained from the different sources of knowledge such production logs; you have identified transaction volume for each business-critical transaction and the peak load volume. The next step is ascertaining required pacing and thinking time to build the workload model. The mathematical principle that I use to build this simulation model is Little's law of queueing theory which states that the long-term average number L of customers in a stationary system is equal to the long-term average effective arrival rate λ multiplied by the average time W that a customer spends in the system. Expressed algebraically the law is
L = λ W
Business Process Steps Avg think time(seconds) Total think time(W) Total Users(L) Pacing time(λ) BP-1 5 10 50 30 1.6 BP-2 10 10 100 200 2 BP-3 7 10 70 140 2 BP-4 14 10 140 300 2.14 BP-5 11 10 110 300 2.7
W - Think time is average time users spend on every page. L - Total users during peak load hour λ – Interval between the iteration of same transactions.
Suggestions :
Use the above steps to execute your baseline performance tests. To achieve expected TPS, modify your total user count, pacing time values for in-scope transactions for any other goal-oriented performance testing such as stress or scalable testing.
Vijay Hatewar


